3. Getting Started
This section describes how to use the Tester’s main features.
3.1. Starting and Stopping Tester
Tester may be started by running the OpenSplice Tester application or from a command prompt and oslptest with the following command line arguments:
- -? or -help
Display the command line options
- -ns
No splash screen
- -uri <uri>
URI to connect
- -nac
No auto-connect upon application start
- -s <path to script>
Script to run
- -b <path to batch file>
Batch script to run
- -noplugins
Do not process plugins
- -plugindir <dir>
Extra plugin directory to search
- -headless
Run script or batch script without the GUI
- -rc <port>
Enable remote control (via <port>)
- -dsl <language>
Default script language
- -l <path to topic file>
Load topics from file
(These preferences can also be set from the menu File > Preferences.)
3.2. Starting - Local Connection
![]() On Windows, use either of the shortcuts created by the installer (on the desktop and
in Start > Programs) to start Tester.
On Windows, use either of the shortcuts created by the installer (on the desktop and
in Start > Programs) to start Tester.
![]() On Linux go to the installation directory and execute the command:
On Linux go to the installation directory and execute the command:
% ospltest
This will start Tester with separate windows.
3.3. Starting - Remote Connection
To connect to a remote platform, execute the command:
% ospltest -uri http://perf1.perfnet.ptnl:50000
(Port number 50000 is the default port in a standard DDS shared-memory deployment.)
3.4. Stopping
Stop Tester either by using the menu option File > Exit or by clicking
on the main window `close’ button ![]() .
.
3.5. Remotely Controlling Tester
Starting Tester in remote control mode e.g. "ospltest -rc <port>
-headless" allows Tester to be controlled from another application,
shell script, etc..
Use cases for remote control include:
Using Tester in combination with a commercial or proprietary test system;
Within a continuous build and test environment this would provide more options to control DDS testing in combination with other application-specific testing;
In an integrated development environment like Eclipse using Junit for testing.
A Tester instance is controlled via a TCP/IP connection. Text-based commands are sent over this connection.
The remote control application can be used by executing the command:
ospltestrc [-p <port>] [-h <host>] <command>
where
<host>is the host name of the machine that the Tester you wish to control is running on
<port>is the port that Tester is listening on (specified by the-rcoption when Tester was started)
<command>is the command to send to Tester.
The remote control commands are:
- stop
Terminate the Tester instance
- batch <batch name>
Execute the batch with
<batch name>- script <script name>
Execute the script with
<script name>- scenario <scenario>
Execute a scenario which is provided in full text on a single line (new lines
"\n"are replaced by" ")- connect <optional uri>
Connect to a specified or the default Domain uri
disconnect
When a command is completed the following is reported on a single line:
Done
When a batch is executed, for each scenario two lines are returned to the test controller:
Scenario: <index> of <count> execute: <scenario name>Scenario: <index> result: <result>
3.6. Trying out Tester
Once you have started Tester, you can get a feeling for how to use it with a few simple exercises:
Create a default reader for some of the registered topics.
Double-click one of the samples and see all the fields of the topic.
Browse through the list of samples using the arrow keys.
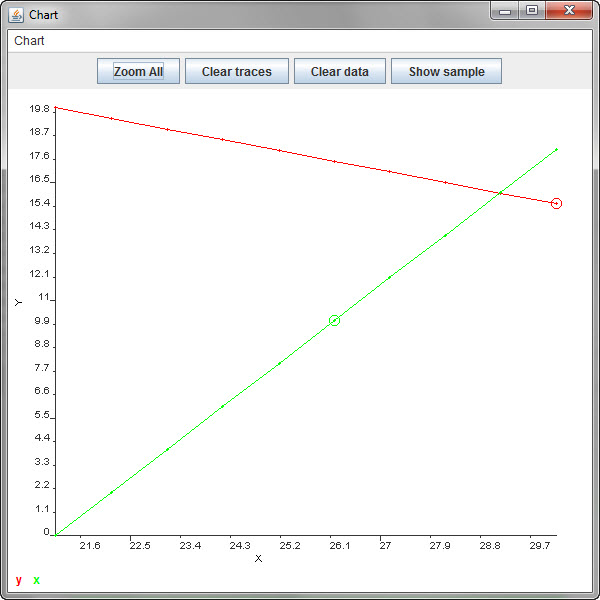
Select a topic in the sample list and press [F9], then select a field for display in the sample list.
Select another topic (it need not be of the same type as the one displayed in the topic instance window) and press [F2] for a comparison between the two topics.
Select a topic in the sample list or in the topic list and press [F4], then in the
Writetopic window set the fields to the desired value and write or dispose the topic.Choose File > Dump on the sample list and save the information of the topic samples in the sample list to a file.
Have a try with the scripting, it can make your life a lot easier (especially with recurring tasks).
The rest of this section describes the features that you will use when you try these exercises.
3.7. Tester Windows
3.7.1. Main Window
Once started, Tester presents the user with the following main window.
Tester main window
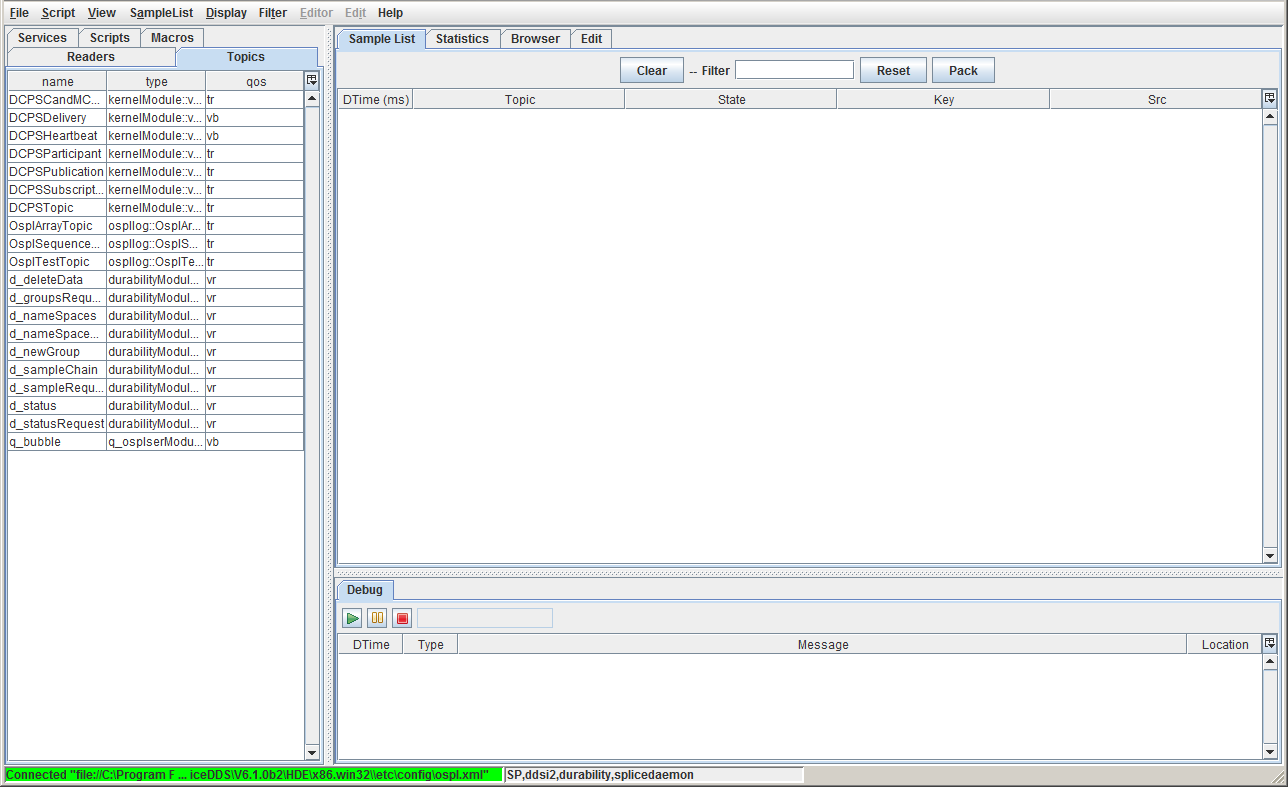
The Command Menu (below) provides direct access to most of the Tester capabilities.

The Tester main window has three sub-frames:
Main tabbed frame for selecting items from a list, such as topics, scenarios, and readers or writers.
Working area frame where you will do most of your work such as editing scenarios, investigate samples, and capturing statistics
Debug frame used to debug scripts and macros.
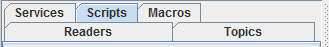
3.7.2. Overview Windows
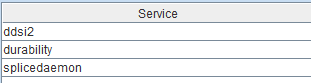
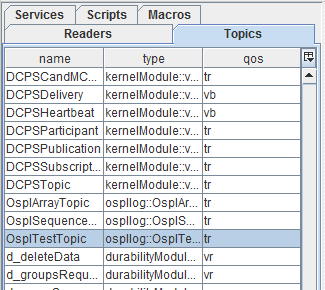
The user can select the type of resource to work with by selecting tabs. These can be the Services and Topics in the system, the Scripts and Macros they have installed, or the Readers for the current Tester timeline.
Tester resource tabs
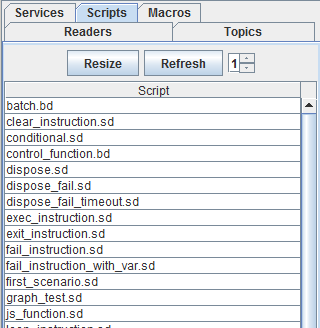
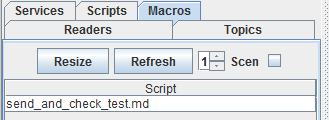
3.7.2.2. Scripts
The script list provides a convenient way of selecting an existing script for editing or execution. The list is filled at startup or when clicking the Refresh button. All files in the specified script directory are added to the list. The script directory (or directories) are specified in the preference page.
A script can be selected in the script editor by single-clicking the entry in the table. When the entry is double-clicked the script is loaded in the script editor and executed.
Tester scripts tab
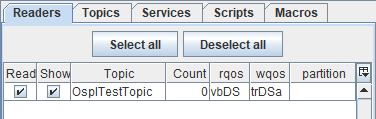
3.7.2.5. Readers
The readers list displays the readers (and implicit topic writers) for the current Tester timeline. The default name for a reader is the same as the name of the topic it is subscribed to. For each reader the count of received samples (as available in the sample list) is displayed. A check box is provided for changing the read state or the show state. When Read is unchecked the reader stops reading topics. When Show is unchecked the topic of that topic will not be displayed in the sample list.
Tester readers tab
3.7.3. Working Windows
These windows support testing activities.
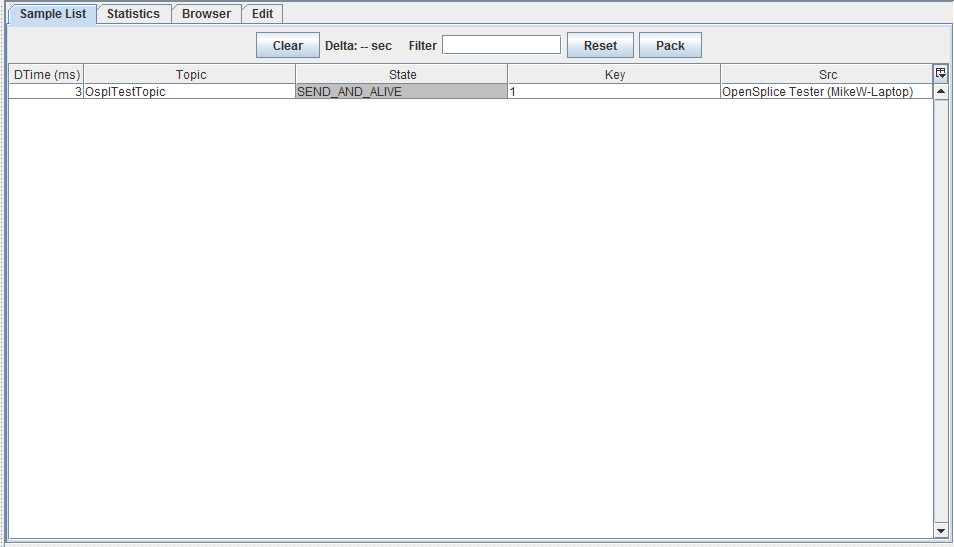
3.7.3.1. Sample List Window
Used to view and generate samples for the current timeline (Readers).
Sample list window
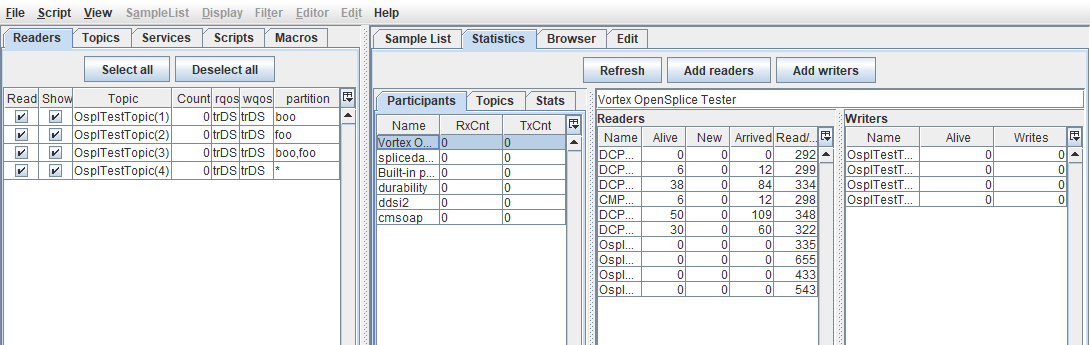
3.7.3.2. Statistics Window
The statistics window provides statistics for the topics in use, like write count, number of alive topics, etc.. Statistics are gathered from the local copy of OpenSplice. To gather statistics from remote nodes, use OpenSplice Tuner.
Statistics window
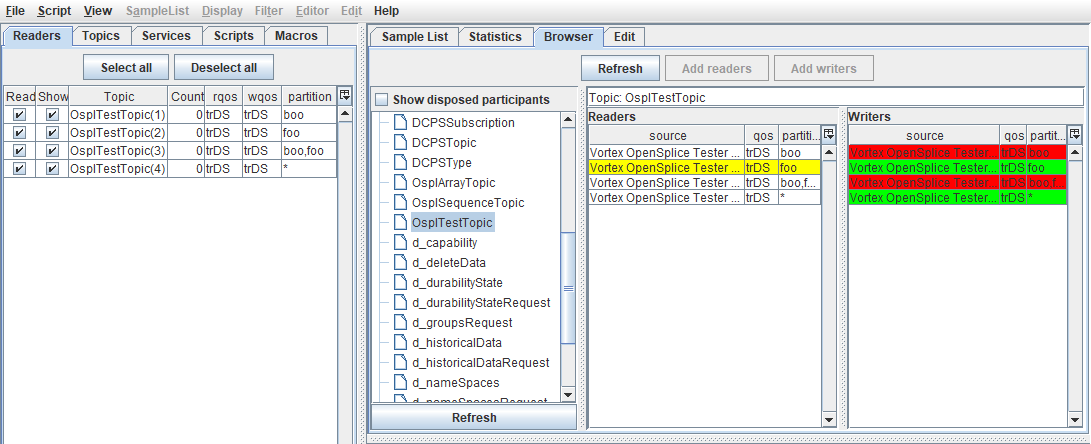
3.7.3.3. Browser Window
The browser window provides information about nodes, executables, participants (applications), readers, writers and topics. Information can be browsed by selecting a node/executable participant or a topic. When an executable or participant is selected the reader and writer lists (subscribed and published topics) for that executable/participant are shown. Together with the topic name concise information about the QoS and partition is shown. When the mouse cursor is hovered over the QoS value the hint will show detailed information about the QoS.
When a topic is selected the list of participant readers (subscribe) and writers (publish) are shown, together with concise information about the QoS and partition. By selecting a row in either the reader of writer list the compatible readers/writers will be shown in green and non-compatible (by QoS/partition) readers/writers will be shown in red.
Tester browser window
3.7.4. Scripting Windows
3.7.4.1. Edit Window
The script window is used for editing scripts. The editor supports syntax highlighting, auto-completion, and more.
Script editing window
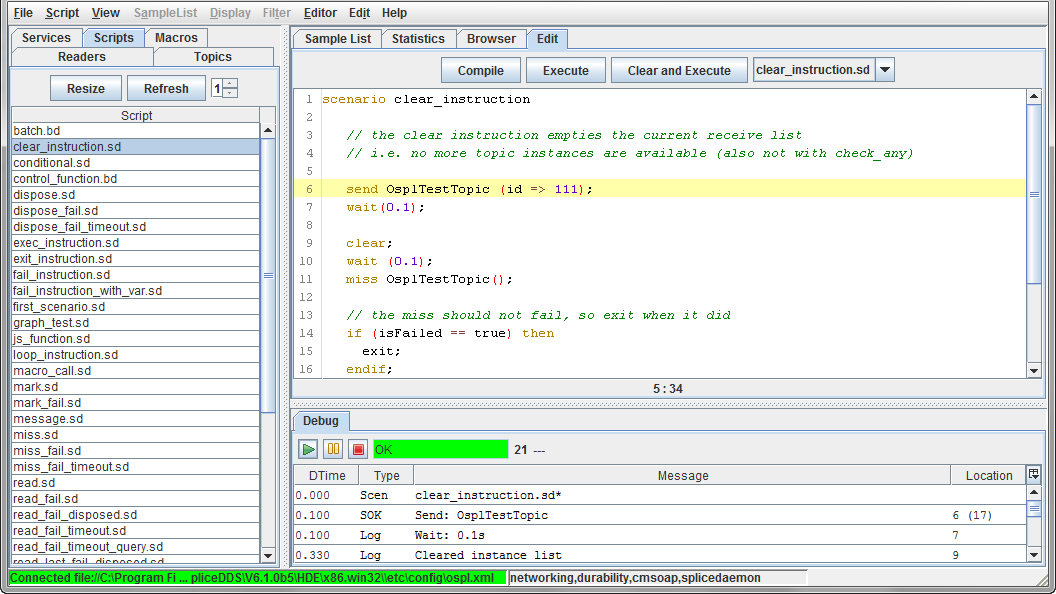
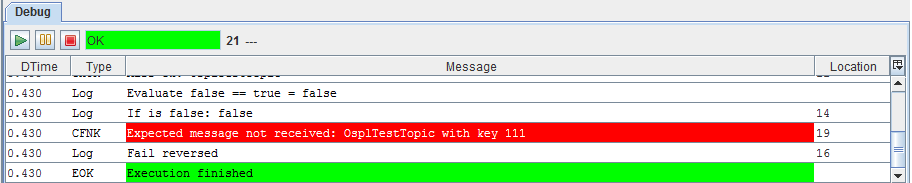
3.7.4.2. Debug Window
The debug window displays compile and execution results. Details can be filtered. Positive results are highlighted with green, negative results are highlighted with red.
Debug window
3.7.5. Other Windows
The following dialog windows will be used.
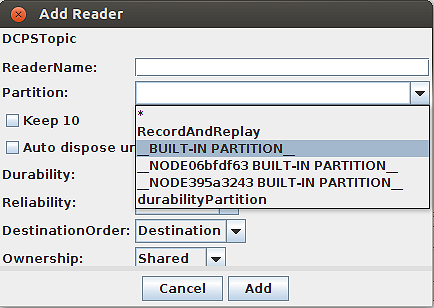
3.7.5.1. Add Reader Window
Used to create/define a new Reader.
The dialog provides a drop-down list of existing partitions to choose to create the new Reader in.
Add Reader dialog
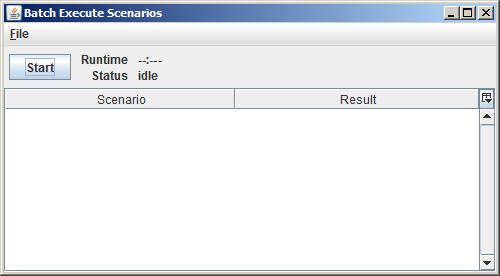
3.7.5.2. Batch Window
Used to Start a batch scenario and display the test results.
Batch Execute Scenarios window
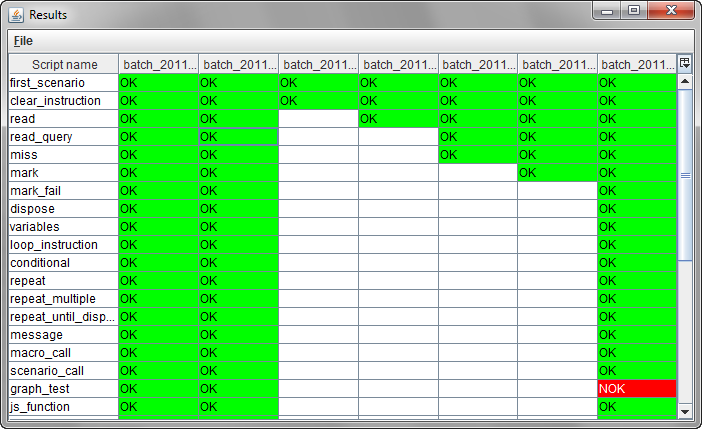
3.7.5.3. Batch Results Window
Displays the detailed results of a batch of scripts. Detailed individual test result can be viewed by double-clicking on a test result.
Batch results window
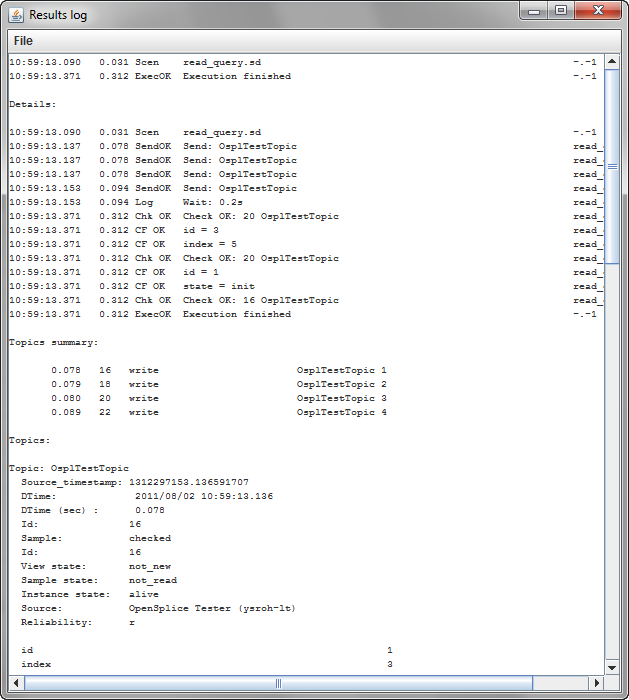
Detailed Batch results log
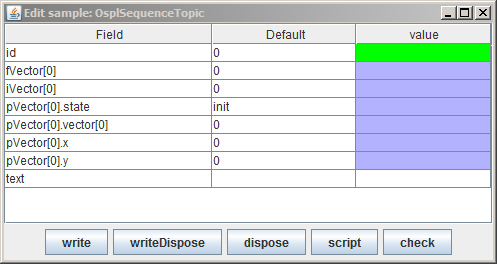
3.7.5.6. Topic Instance Window
The topic sample window is used for displaying field values of a topic. It can be opened by double-clicking a sample in the sample list or by pressing [F3] (additional) or [F2] (additional with compare) in the sample list while a sample is selected. Special fields are highlighted with colors:
Key field (Green)
Foreign key (Yellow)
Different (compare only) (Red)
Not existing (compare only) (Orange)
When a field is selected, [Ctrl+H] will toggle between normal and hexadecimal representation, and [Ctrl+D] will toggle between normal and degrees/radians representation.